Soil health tests are a big conversation topic these days, but there’s a lot of conflicting information out there. Presented by Stacy Zuber, Ph.D., State Soil Health Specialist with USDA Natural Resources Conservation Service, this webinar discusses how soil health tests differ from measuring soil fertility, sampling and handling procedures and how to interpret your results.
Presenter: Stacy Zuber, Ph.D., State Soil Health Specialist with the... Read More →
ILSOYADVISOR POST
Agronomy: Dropping Potassium Levels in Illinois
March 31, 2015
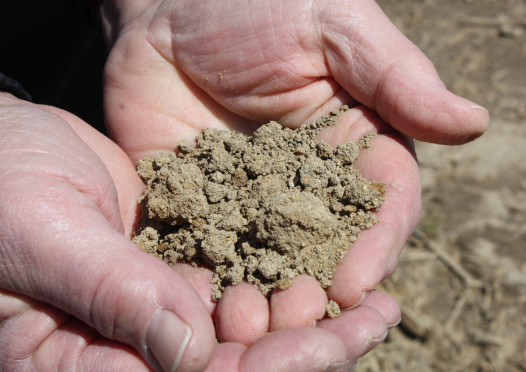
Parts of the Corn Belt are experiencing significant potassium declines due to greater than anticipated crop removal due to the high yields coming off fields. Unfortunately, fertilizer rates haven’t increased significantly to compensate and soil test levels are increasingly below critical values.
Robert Mullen, agronomist with the Potash Corporation, agrees soil test levels for phosphorus (P) and potassium (K) are a concern. “While P levels are trending down, acknowledging that organic matter can be a significant source of phosphorus, chemical buffering of soil phosphorus is the larger source of buffering. However the chemically bound phosphorus is the primarily source of buffered phosphorus available in the soil system. However, K is also trending down, but there is no buffer in organic matter to provide additional K. Potassium does have mineral and interlayer exchangeable sources of K that can buffer soil test levels.”
The International Plant Nutrition Institute (IPNI) has conducted 10 surveys of soil test levels in North America. In 2015 they will be conducting their 11th. In the survey, conducted across the U.S. using data collected from public and private laboratories, they track phosphorus, potassium, pH, magnesium, chloride, sulfur and zinc.
The 2010 IPNI survey reported the median P level for North America of 25 parts per million (ppm) declined 6 ppm from 2005. The region of most consistent declines was the Corn Belt. Illinois soil test levels also declined 6 ppm to a median level of 22. The IPNI summary stated, “The decline has major agronomic significance since a high percentage of samples from the region now test below critical levels,” and called for annual P fertilization to avoid yield reductions.
Parts of the Corn Belt also showed significant declines in K. The IPNI report suggested some of the changes are also due to factors other than nutrient removal, such as weather patterns that can influence equilibrium between soil test extractable and non-extractable K forms. In 2010 in Illinois the median soil test value for K was 179 ppm (critical level is 125/250 and 180/360 ppm/lbs. per acre for low and high CEC soils, respectively). In 2010 30% of the samples tested were below this critical level. What will the percentage below critical be in 2015?
Figure 1. Median soil test K levels in 2010 (Courtesy of IPNI).

Figure 2. Percent of samples testing below critical levels for K for major crops in 2010 (Courtesy of IPNI).

“IPNI reports the percent of soil test values that are below a critical level,” said Mullen. “We have learned that this is a telling metric. It is interesting that in places like Iowa, 55% of the soil test levels are at or below a critical value while in Illinois it is 30% below. That means we haven’t kept pace with K removal rates and growers are under-applying K relative to N (nitrogen) and P.”
Today potash may become more attractive and it is a good time to consider investing some of those fertilizer dollars into potash to reverse the downward trend. “This nutrient reduction strategy will have an impact on N and P budgets,” said Mullen. “It will shift how growers manage N and P. This will open up an opportunity to provide more K.”
The publication “The Fertility of North American Soils, 2010” is available at the IPNI website at:
Agronomist Dr. Daniel Davidson posts blogs on agronomy-related topics. Feel free to contact him at djdavidson@agwrite.com.

Dan Davidson
Soybean agronomist Daniel Davidson, Ph.D., posts blogs on topics related to soybean agronomy. Feel free to contact him at djdavidson@agwrite.com or ring him at 402-649-5919.
Comments
Add new comment