If I were to ask the question, “What are the two largest management factors that come to mind when you hear soybean management factors?” What would your answer be? For myself, the top two things that come to mind are early planting date (late March and April) and herbicide resistance.
Early planting date has arguably been the biggest soybean yield driver because of the increased number of days before the plant starts to flower. This allows... Read More →
ILSOYADVISOR POST
Balance Sheet Benchmarking: Know Your Numbers
June 20, 2020
Creating a balance sheet is one of the first and most crucial steps when considering the health of your farm and potential changes in your investments. A balance sheet evaluates total assets minus total liabilities, showing an operation’s net worth. The truth is that looking at the balance sheet can give clues to areas of strength or weaknesses.
Keep in mind that MANY factors should be considered when reviewing the financial stability of an operation. As the manager and CEO of your farm operation, you have the ability to calculate and evaluate key financial characteristics that are found within your balance sheet figures. After calculating key factors (i.e., working capital, working capital ratio, debt to asset, debt to equity), you should compare those figures over a period of years to identify trends within your operation.
Characteristics to Identify
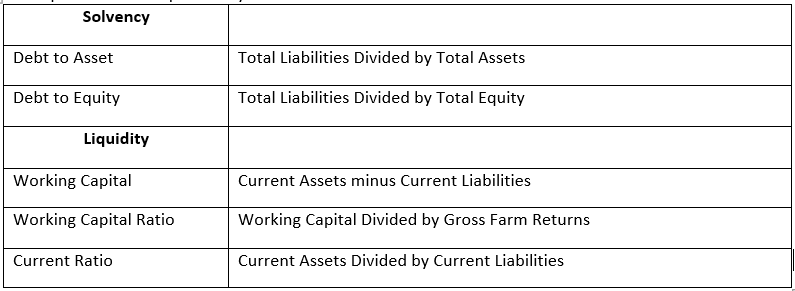
Each financial statement (income statement, balance sheet, cash flow, etc.) can provide valuable insight. Today, we are going to highlight a few financial pieces from your balance sheet that stakeholders find important. First let’s discuss two different ideas: solvency and liquidity. Solvency is defined as the possession of assets in excess of liabilities; the ability to pay one’s debts. Debt to Asset and Debt to Equity are measures of solvency, which will be illustrated later in this article. Liquidity is defined as the availability of liquid assets to your farm. Working Capital, Working Capital Ratio and Current Ratio are measures of liquidity, which will be illustrated later in this article.
Calculations and Benchmarking
The equations for the previously mentioned ratios and financial characteristics are as follows:

After the above calculations are complete, business owners will want to compare their results with others in the same industry.
Historic Benchmarks
Industry benchmarks are available at your fingertips for comparison as well! Use them as much as possible to help you better understand your financial results compared to the averages. Please note that it is extremely important to compare your operation to those of a similar size, type and age group. One great item to complete each year (using your own information) is the Farm Financial Scorecard1, provided by the Center for Farm Financial Management. The financial scorecard provides a color-coded analysis of “good, better and best” to help you identify areas where your operation excels and where there is room for improvement. Now let’s take a look at some interesting benchmarks from Illinois FBFM farms over the past five years2:

Information in this table provided by Illinois FBFM farm data.*
Over the last five years we note the debt to asset ratio slowly increases as incomes have come down from the highs in 2011 and 2012, as well as increased variability. We also find a decreasing trend in the liquidity measures due to lower incomes.
Summary
As we continue to grow, innovate and operate in these unusual conditions, it is crucial to understand your global financial picture. One ratio being “good” or “bad” doesn’t mean that your entire operation is “good” or “bad.” Knowing your numbers provides important insight into your operation and can help you identify opportunities for expansion and strengthening. Continue to take every chance to increase your knowledge base and advance your career in agriculture!
References
1Farm Financial Scorecard provided by the Center for Farm Financial Management and University of Vermont. Available at: https://www.cffm.umn.edu/wp-content/uploads/2019/02/FarmFinanceScorecard.pdf
2Illinois FBFM 2018 Farm Business Results. Available at: www.fbfm.org
*The author would like to acknowledge that data used in this study comes from the local Farm Business Farm Management (FBFM) Associations across the State of Illinois. Without their cooperation, information as comprehensive and accurate as this would not be available for educational purposes. FBFM, which consists of 5,500 plus farmers and 60 plus professional field staff, is a not-for-profit organization available to all farm operators in Illinois. FBFM field staff provide on-farm counsel with computerized recordkeeping, farm financial management, business entity planning and income tax management. For more information, please contact the State FBFM Office located at the University of Illinois Department of Agricultural and Consumer Economics at 217-333-8346 or visit the FBFM website at www.fbfm.org.


Comments
Add new comment