ILSOYADVISOR POST
Diagnostics: Analyzing Yield Data – Using the Technology to Learn More (Part II)
Watching a yield monitor and collecting yield data is easy and it’s easier than ever to transfer it to a computer and through a wireless network. But the challenge is—do you actually analyze the data and do more with it than just making pretty maps?
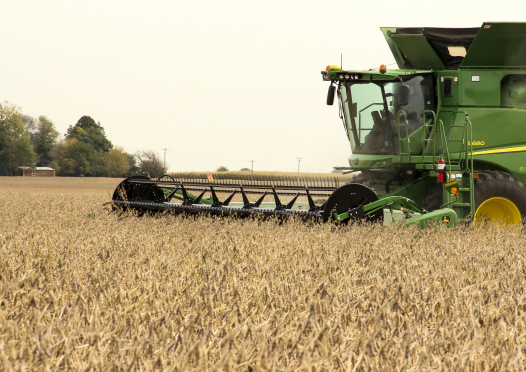
Mapping yield is a great tool at harvest. Not only can you track yield and moisture during harvest, you can do yield checks on the go by identifying loads as part of an on-farm research program. But the real value of yield maps comes from linking it to other data sources, doing analysis and interpretations and making better decisions in the future.
Analyzing data and extracting valuable information to make better decisions has always been the challenge of precision agriculture since its inception 20 years ago. It’s easy to acquire the technology, but it takes more commitment to get the fullest value from your investment. The challenge hasn’t gotten any easier and the amount of data you can collect has grown significantly in that period of time.
Yield maps represent the output of your crop production efforts. On one hand this information can be used to identify the location of limiting factors in individual fields. However, it can’t identify the cause. On the other hand, a multi-year yield history can be used to better define better yield potential as well as where limiting factors occur most commonly. This information will enable you to vary inputs according to expected field productivity.
And it’s essential to think long term. Yield data from one harvest may be interesting, but multi-year data really make the most sense and can make the biggest difference. The larger your data set, the easier it is to see trends in yield variability, and the easier it is to know what changes to make in order to maximize yield.
Yield maps are a good starting point for developing a site-specific program. High- and low-yielding areas point out where you are doing things correctly and where something is limiting. The next question you have to ask is what’s causing the yield variability? Is it pH, drainage, compaction, fertility, variety placement, soil type, residue coverage, or any number of other factors that can impact yield? One thing is certain, yield maps provide the opportunity to assess your fields during the evaluation phase of last season and help you prepare for the planning phase for next season.
With the ability to collect more and more information on the go and with spatial (GPS) reference points, there is more work involved in handling all this information and new skills required to analyze and interpret it. We are hearing a lot about Big Data today in reference to all the information that can be collected in real time. Companies like Monsanto, John Deere, Cargill, DuPont Pioneer and others are scrambling to help farmers do more with the reams of data they are collecting.
As a former precision agriculture agronomist for a major retailer, I recognized that it was difficult enough for me, an agronomist and novice GIS technician, to keep up with the technology and that was my job. I can surmise that individual producers probably don’t have the time to acquire the skills to master these tasks. In the last two decades that hasn’t changed and we are collecting even more information today. That means to get value from all this data and make better production decisions on every acre, it makes sense to hire someone to do this for you. Not only will they provide you with the skills and knowledge to process the data, they can provide a fresh agronomic perspective as well.
Specialists have the ability to layer yield with various field data including EC, elevation, soil type, pH, nutrient levels, varieties, weather, imagery, fertilizers, chemicals, etc. Analyzing the data provides insight as to what is affecting yield and can help you determine what management practices you need to follow and how you can adjust that across the field. With all this information at hand, a specialist can write a prescription for each and every acre whether you are farming on the grid or on a zone basis.
Today, farmers are sitting on reams of yield and production data, not doing a lot with it and collecting even more. Sitting on that data and not taking the time to analyze it could very easily limit your ability to maximize profit. Although yield data analysis is a complicated affair, the only way to get more knowledgeable about the process is to go out, get involved and get it done. By doing that, you can better your chances of increasing yield over the next couple of years as you map out long-term data, start seeing truly meaningful patterns emerge and begin to better manage those patterns.
Agronomist Dr. Daniel Davidson posts blogs on agronomy-related topics. Feel free to contact him at djdavidson@agrwrite.com.


Comments
Add new comment