ILSOYADVISOR POST
Agronomics: Analyzing Yield Data – Using the Technology (Part I)
The soybean crop is nearly finished, or soon will be, and full-season bean harvest will be done in a few weeks, followed by double-crop soybeans. Don’t end the season by just counting the bushels you sold or put in storage and calculating your revenue. After the season is over, take some time to evaluate how each field performed in reference to its potential and the practices you deployed.
An average field yield doesn’t tell you much beyond how your field performed in a given year compared to the past and how a particular maturity group did relative to other varieties planted. However, yield maps are good tools for analyzing field performance, identifying field or production weaknesses and looking for opportunities for optimizing soil conditions or improving production practices.
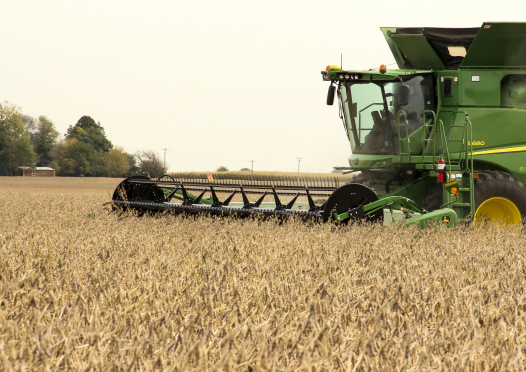
Today’s combines, and those manufactured during the last decade or more, come equipped with yield monitors and all the necessary hardware to record yield and moisture. This equipment worked for monitoring yields in the field in real time, but did not allow you to make yield maps unless you added a GPS receiver. Today, with the convenience and accuracy of auto steer, all late model combines have a GPS receiver.
Mapping yield is a great tool at harvest. Not only can you track yield and moisture as you harvest, you can do yield checks on-the-go by identifying loads and then flagging areas with issues where the causes are obvious. But the real value of yield maps comes during interpretations and making future decisions.
Yield monitors don’t make maps. You have to download the data and use GIS software to produce colorful maps. However, remember that colorful maps are only data, not knowledge or decisions. If these maps are to be of any value, data generated from them and other sources must be turned into knowledge, which is incorporated into making better management decisions. And that is where the challenge lies.
The value of a yield map is in its interpretation. It exhibits spatial distribution in yield across a field and creates an opportunity to ask questions about why, but it doesn’t provide the answers. A yield map is only of value when it leads to assessing how a crop did under its soil environment and the management practices you deployed. Do you evaluate them to see if they optimize the potential of every acre? If you don’t do that, they are no more than pretty maps and a historical yield record—something you can share with the landlord.
Interpreting yield maps can be a challenging process. In a yield map yields can range 100 or more bushels in corn and 20 or more bushels in soybeans. Some of the known reasons for variability include: changes in variety; compaction or surface drainage; soil type, fertility levels or soil quality; landscape position (low wet areas vs. hill tops) or field history; outbreaks of diseases, pests, weeds; lodging; or mechanical or human errors.
One of the great things about this technology is that you can overlay yield maps with other spatial maps of soil conditions, soil test levels, production practices, etc. and begin to look for patterns in the yield that suggest causes. You can ground truth to validate the cause if you know where to look. You also can flag an area in the field while harvesting and note what the cause of yield loss may be.
Yield maps are wonderful tools and have created a great opportunity to improve your management practices and how you spatially manage a field. Look for Part II next week where we discuss how to interpret data and make better management decisions.
Get Involved: Let us know how you use your yield monitor data and yield maps to improve your management decision in our forums.
Agronomist Dr. Daniel Davidson posts blogs on agronomy-related topics. Feel free to contact him at djdavidson@agrwrite.com.


Comments
Add new comment